IC Markets Home Assinar em Web Trader Contacte-nos
IC Markets Social IC Markets Social

Centro de Informação para
Traders Sérios

  • Sobre nós
  • ABRA UMA CONTA DE NEGOCIAÇÃO
  • TESTE UM DEMO GRATUITO
  • Comece a Operar
  • Visite nosso blog
IC Markets Social
  • Sobre nós
  • ABRA UMA CONTA DE NEGOCIAÇÃO
  • TESTE UM DEMO GRATUITO
  • Comece a Operar
  • Visite nosso blog
February 7, 2024Australian_Stocks_enIC Markets

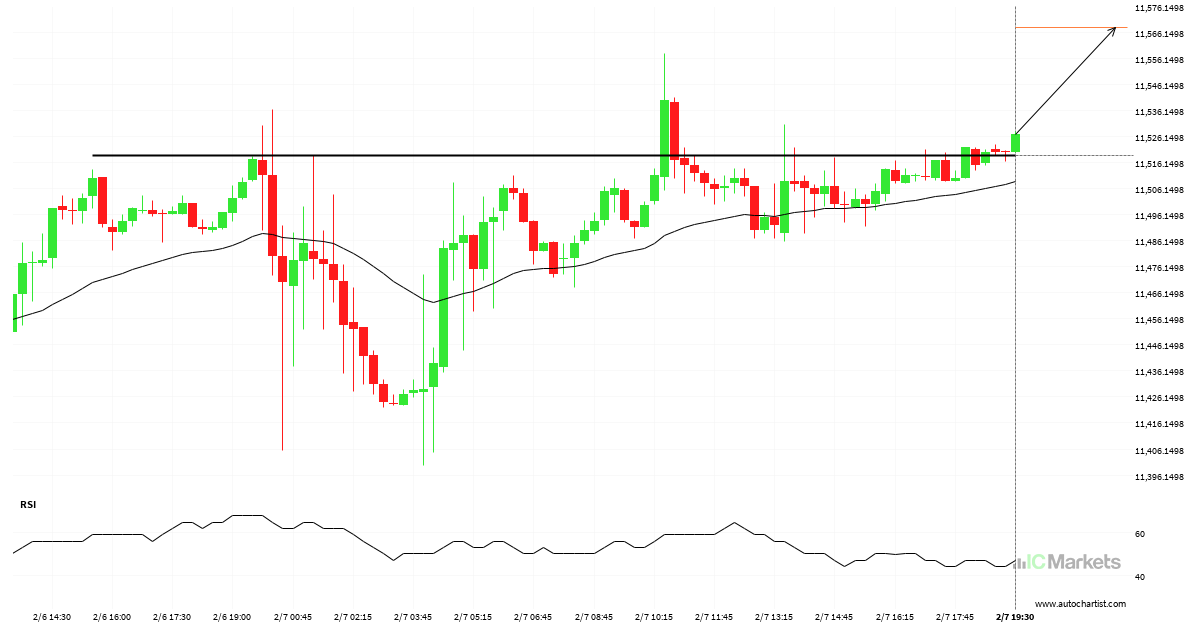
Should we expect a bullish trend on FTSE China A50 Index?

The price of FTSE China A50 Index in heading in the direction of 11567.7598. Despite the recent breakout through 11518.8604 it is possible that it will struggle to gain momentum to the forecast price and move back in the other direction. This has happened many times in the past so watch for a possible bounce […]

Read more
February 6, 2024Australian_Stocks_enIC Markets

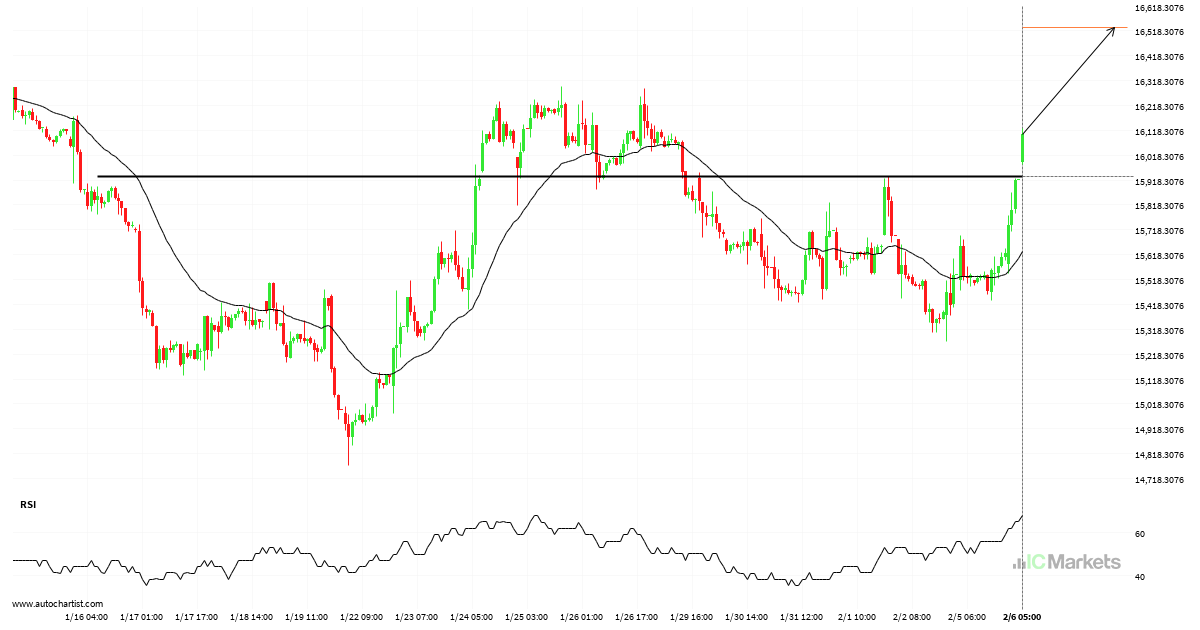
Should we expect a bullish trend on Hong Kong 50 Index?

Hong Kong 50 Index has breached the resistance line at 15933.6104. It may conitnue the bullish trend towards 16530.4063, or, it may prove to be yet another test of this level.

Read more
February 5, 2024Australian_Stocks_enIC Markets

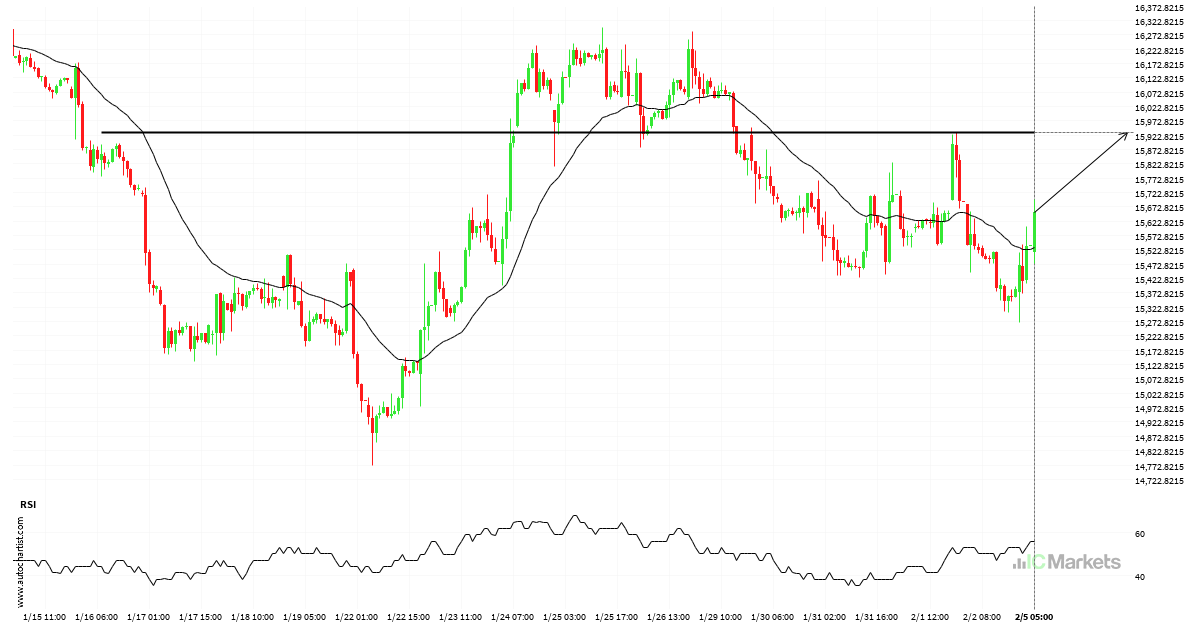
A potential bullish movement on Hong Kong 50 Index

A strong resistance level has been identified at 15933.6104 on the 1 hour Hong Kong 50 Index chart. Hong Kong 50 Index is likely to test it soon.

Read more
February 2, 2024Australian_Stocks_enIC Markets

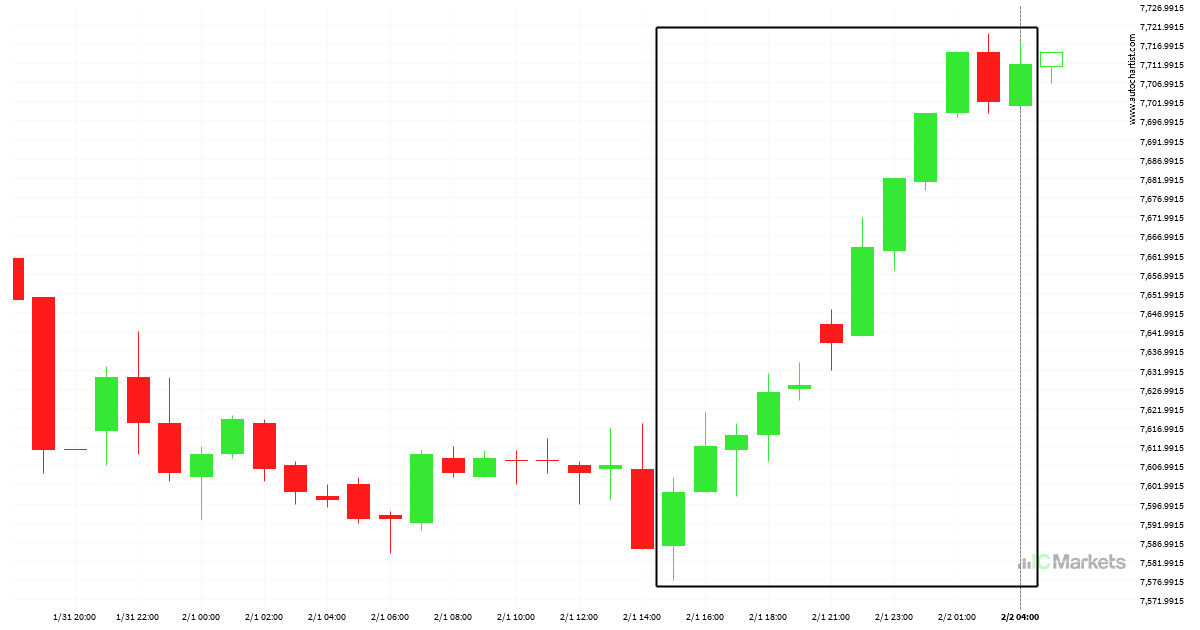
Australia 200 Index experienced an exceptionally large movement

Australia 200 Index hits 7711.85 after a 1.47% move spanning 13 hours.

Read more
February 1, 2024Australian_Stocks_enIC Markets

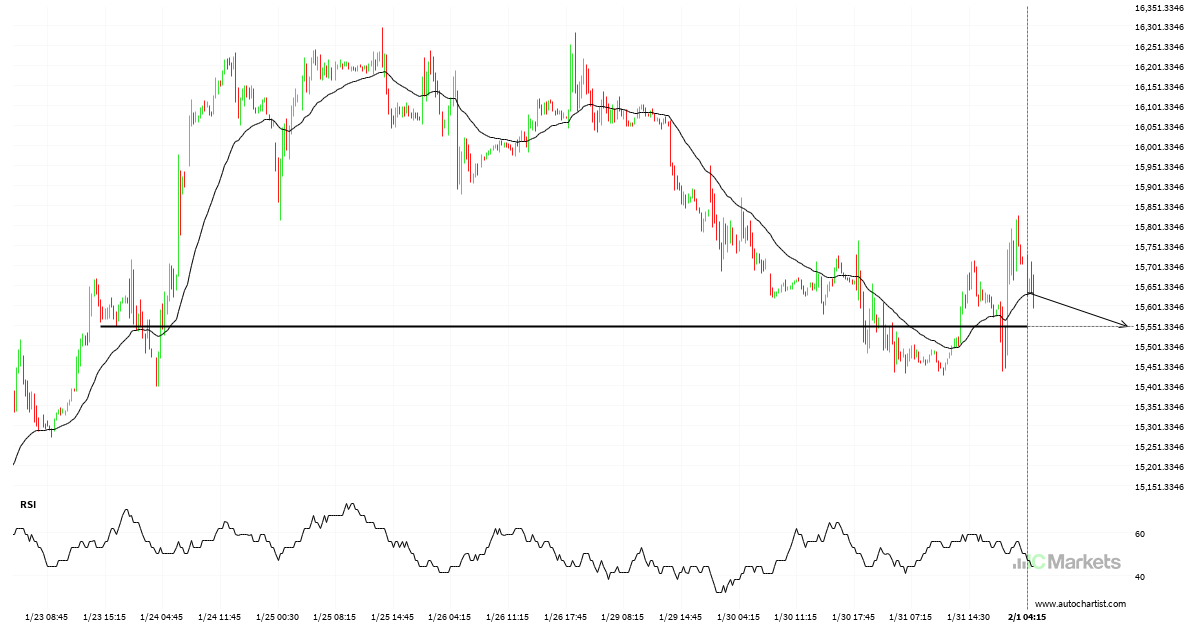
Hong Kong 50 Index approaching support level

A strong support level has been identified at 15548.4502 on the 15 Minutes Hong Kong 50 Index chart. Hong Kong 50 Index is likely to test it soon.

Read more
January 30, 2024Australian_Stocks_enIC Markets

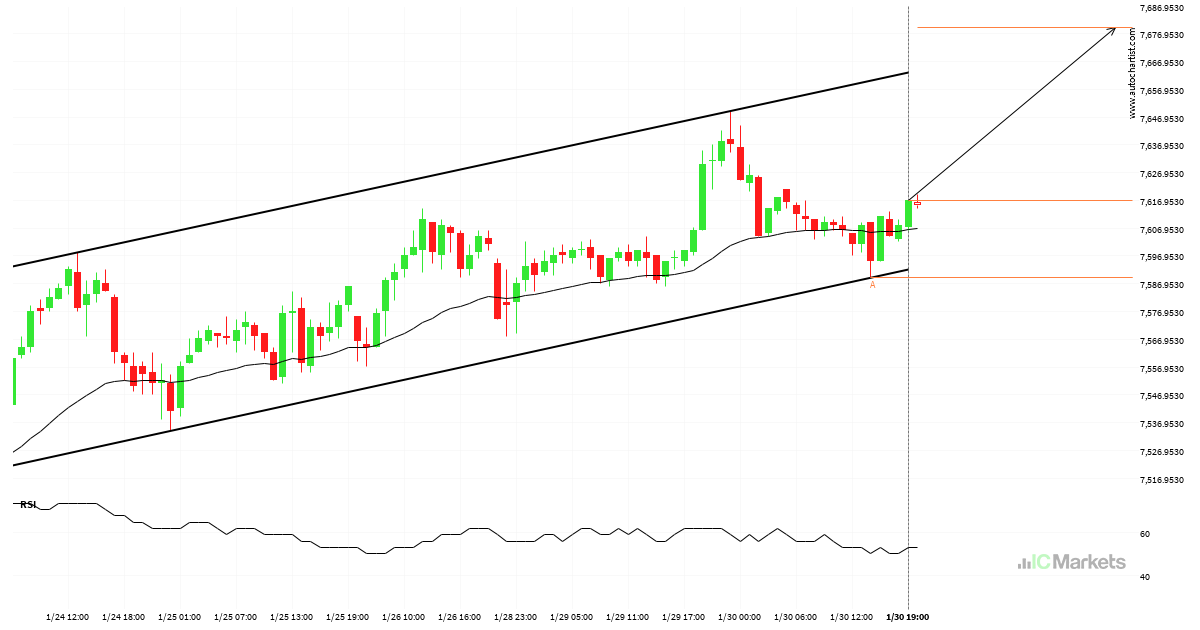
Possible breach of resistance level by Australia 200 Index

Emerging Channel Up pattern in its final wave was identified on the Australia 200 Index 1 hour chart. After a strong bullish run, we find Australia 200 Index heading towards the upper triangle line with a possible resistance at 7679.0800. If the resistance shows to hold, the Channel Up pattern suggests a rebound back towards […]

Read more
January 29, 2024Australian_Stocks_enIC Markets

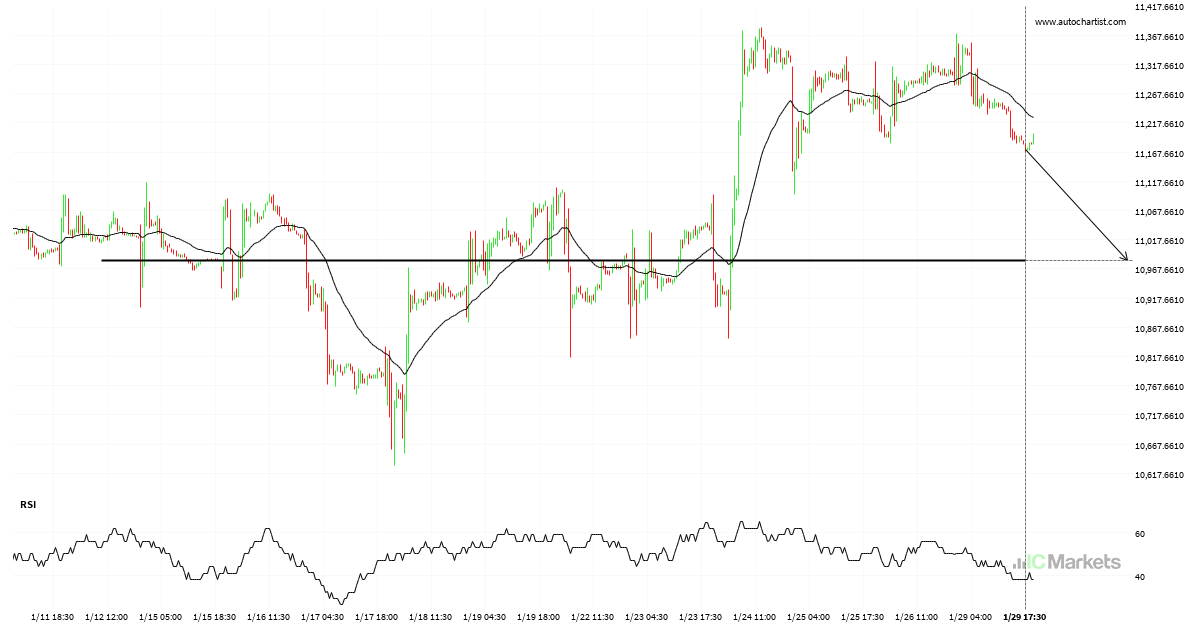
FTSE China A50 Index approaches important level of 10982.5195

FTSE China A50 Index is en route to a very important line that will be a definite deciding factor of what is to come! We may see this trajectory continue to touch and break through 10982.5195, unless it runs out of momentum and pulls back to current levels.

Read more
January 29, 2024Australian_Stocks_enIC Markets

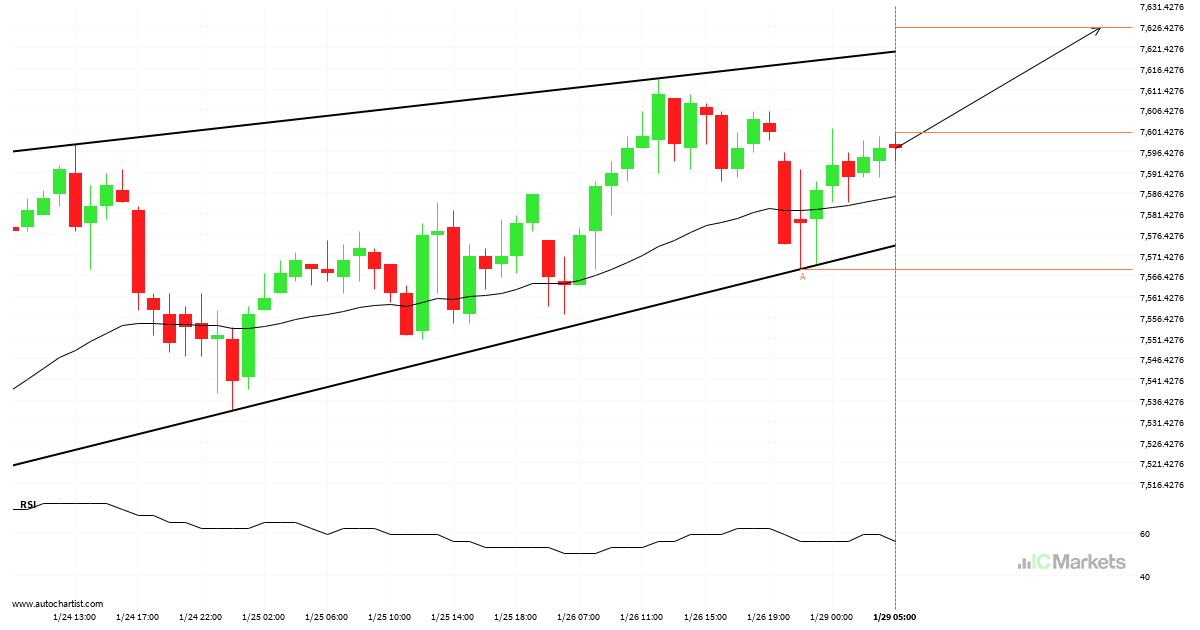
A potential bullish movement on Australia 200 Index

Australia 200 Index is trapped in a Rising Wedge formation, implying that a breakout is Imminent. This is a great trade-setup for both trend and swing traders. It is now approaching a support line that has been tested in the past. Divergence opportunists may be very optimistic about a possible breakout and this may be […]

Read more
January 26, 2024Australian_Stocks_enIC Markets

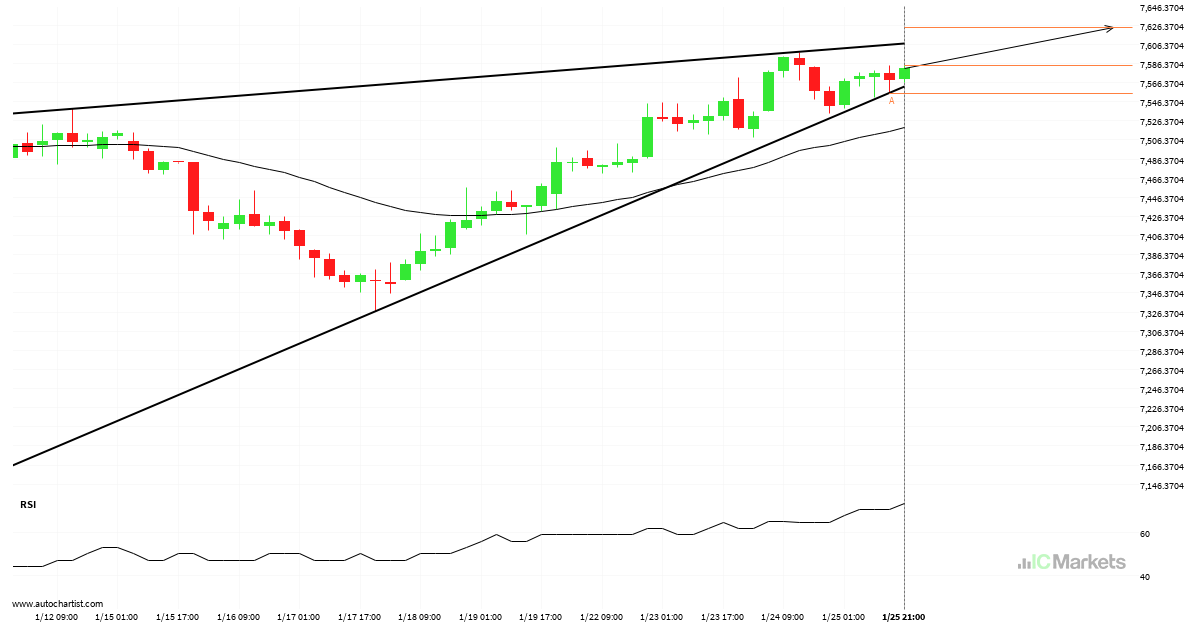
Will Australia 200 Index have enough momentum to break resistance?

An emerging Rising Wedge has been detected on Australia 200 Index on the 4 hour chart. There is a possible move towards 7623.5088 next few candles. Once reaching support it may continue its bullish run or reverse back to current price levels.

Read more
January 25, 2024Australian_Stocks_enIC Markets

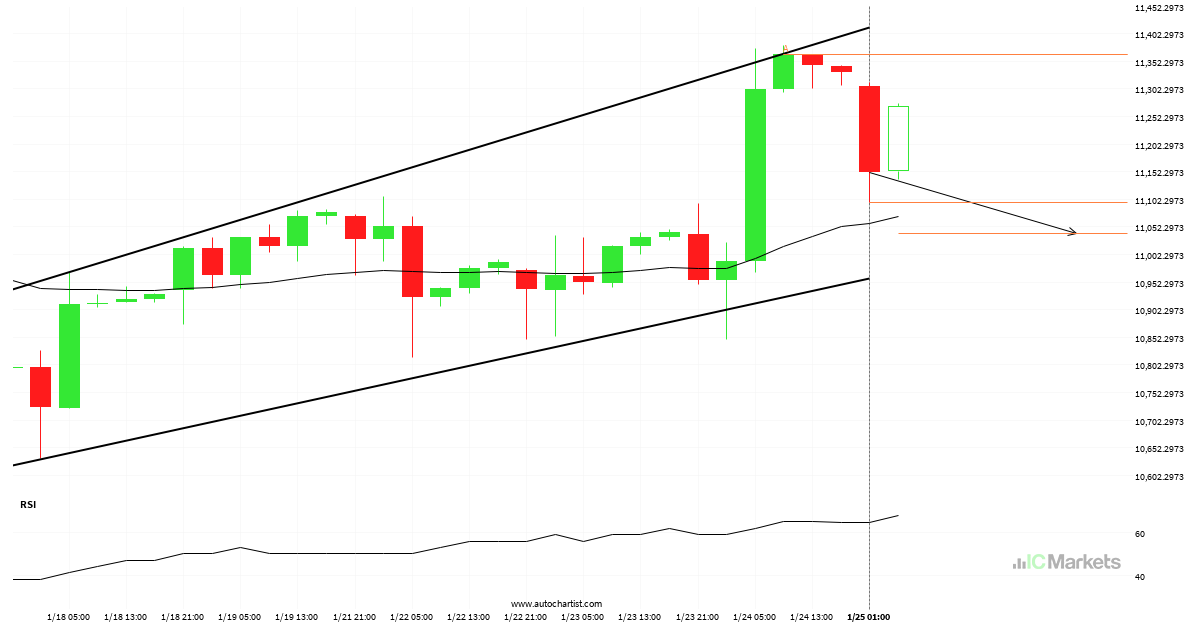
Either a rebound or a breakout imminent on FTSE China A50 Index

FTSE China A50 Index is heading towards the support line of a Flag and could reach this point within the next 2 days. It has tested this line numerous times in the past, and this time could be no different from the past, ending in a rebound instead of a breakout. If the breakout doesn’t […]

Read more
  • 1
  • 2
  • 3
  • …
  • 18
  • 19
  • 20
  • 21
  • 22
  • 23
  • 24
  • …
  • 153
  • 154
  • 155

Recent Posts

  • Hong Kong 50 Index – รูปแบบกราฟ – สามเหลี่ยมขาขึ้น
  • Hong Kong 50 Index – نموذج الرسم البياني – مثلث صاعد
  • Germany 30 Index – ระดับสำคัญ – แนวรับ
  • Germany 30 Index – المستوى الرئيسي – سند
  • Hong Kong 50 Index – المستوى الرئيسي – مقاومة

Recent Comments

    Translation


     Edit Translation

    Negocie com um

    líder de mercado no qual possa confiar

    ABRA UMA CONTA DE NEGOCIAÇÃO TESTE UM DEMO GRATUITO

    Trading com Forex

    • Visão Geral de Contas
    • Abrir uma Conta
    • Lançar Web Trader

    Especificações de Trading

    • Spreads e Comissões
    • Gama de Mercados
    • Horas de Trading
    • Financiamento
    • Levantamento

    Acerca da IC Markets?

    • Help Center
    • Porquê a IC Markets
    • Regulamentação
    • Documentos Legais
    • Contacte-nos


    Forex Trading

    • Accounts Overview
    • Open an Account
    • Launch Web Trader

    Trading Specifications

    • Spreads and Commissions
    • Range of Market
    • Trading Hours
    • Funding
    • Withdrawal

    About IC Markets

    • Chat with a Specialist 24/7
    • Why IC Markets
    • Regulation
    • Legal Documents
    • Contacte-nos

    Isenção de Responsabilidade: Este material corresponde a material de marketing em que todo o material de marketing é publicado apenas para fins informativos. Este material não contém e não deverá ser considerado como contendo - aconselhamento de investimento e recomendações ou sugestões para adotar quaisquer ações relativamente a instrumentos financeiros. Os widgets incorporados pertencem aos seus autores externos independentes e a IC Markets não é responsável pelo seu conteúdo ou pelo seu impacto na negociação.

    Todos os direitos de conteúdo reservados. As opiniões dos autores poderão não coincidir com a opinião dos editores do blog. Aquando da cópia de materiais a partir deste site ou aquando da ligação ao RSS feed, para republicar os nossos artigos, é necessário um link para a IC Markets ou a atribuição no formato 'IC Markets Blog'. Para questões gerais, por favor, entre em contato com a agência editorial através do formulário da nossa página de Contato.

    Alerta de Risco: A negociação de Derivados acarreta um elevado nível de risco para o seu capital e deverá negociar apenas com dinheiro cuja perda possa suportar. A Negociação de Derivados poderá não ser adequada para todos os investidores e, como tal, por favor, certifique-se de que entende plenamente os riscos envolvidos e procure aconselhamento independente, se necessário. Deverá ser considerada uma Declaração de Divulgação de Produto (PDS) antes de efetuar uma transação connosco.

    O conteúdo desta página corresponde apenas a informação geral e não tem em conta a sua situação pessoal, objetivos ou necessidades financeiras. Cabe-lhe a si certificar-se de que os produtos que nós oferecemos se adequam às suas necessidades específicas. Não deverá negociar connosco, a menos que entenda as caraterísticas e os riscos dos produtos que nós oferecemos. Isto significa que poderá precisar de procurar aconselhamento independente antes de começar a negociar connosco.

    © 2022 Raw Trading Ltd | All rights reserved.
    • Sample Page